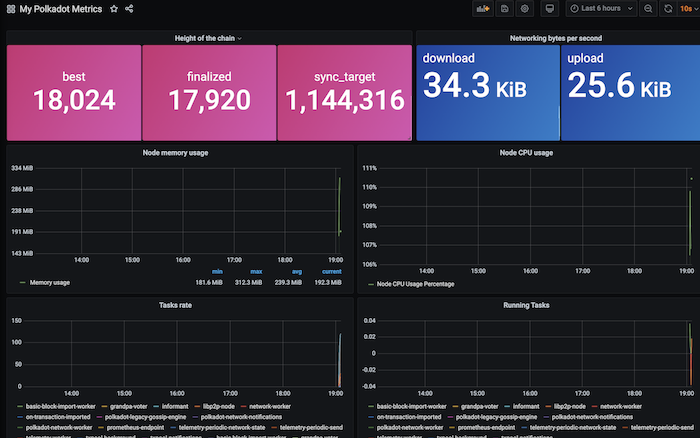
The Prometheus Metrics endpoint exposes information such as the block height or number of peers connected to your node.
This guide shows how to configure Prometheus and Grafana to create a metrics dashboard for your OnFinality Dedicated nodes. It requires Prometheus and Grafana to be installed and basic knowledge of how to set the Prometheus configuration. For a more in depth guide which starts from zero see Polkadot’s https://wiki.polkadot.network/docs/maintain-guides-how-to-monitor-your-node
1. Enable the Metrics Endpoint
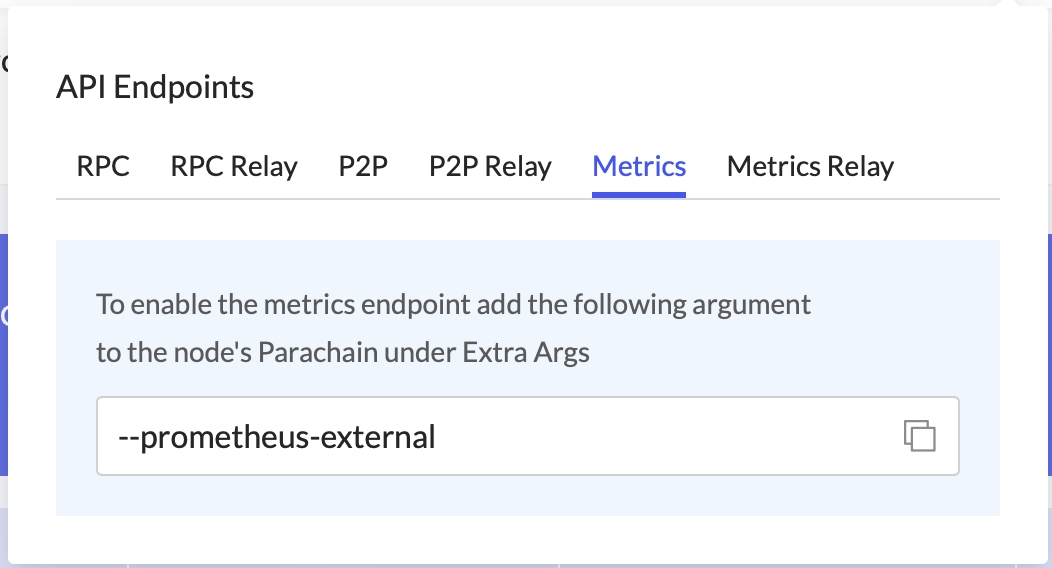
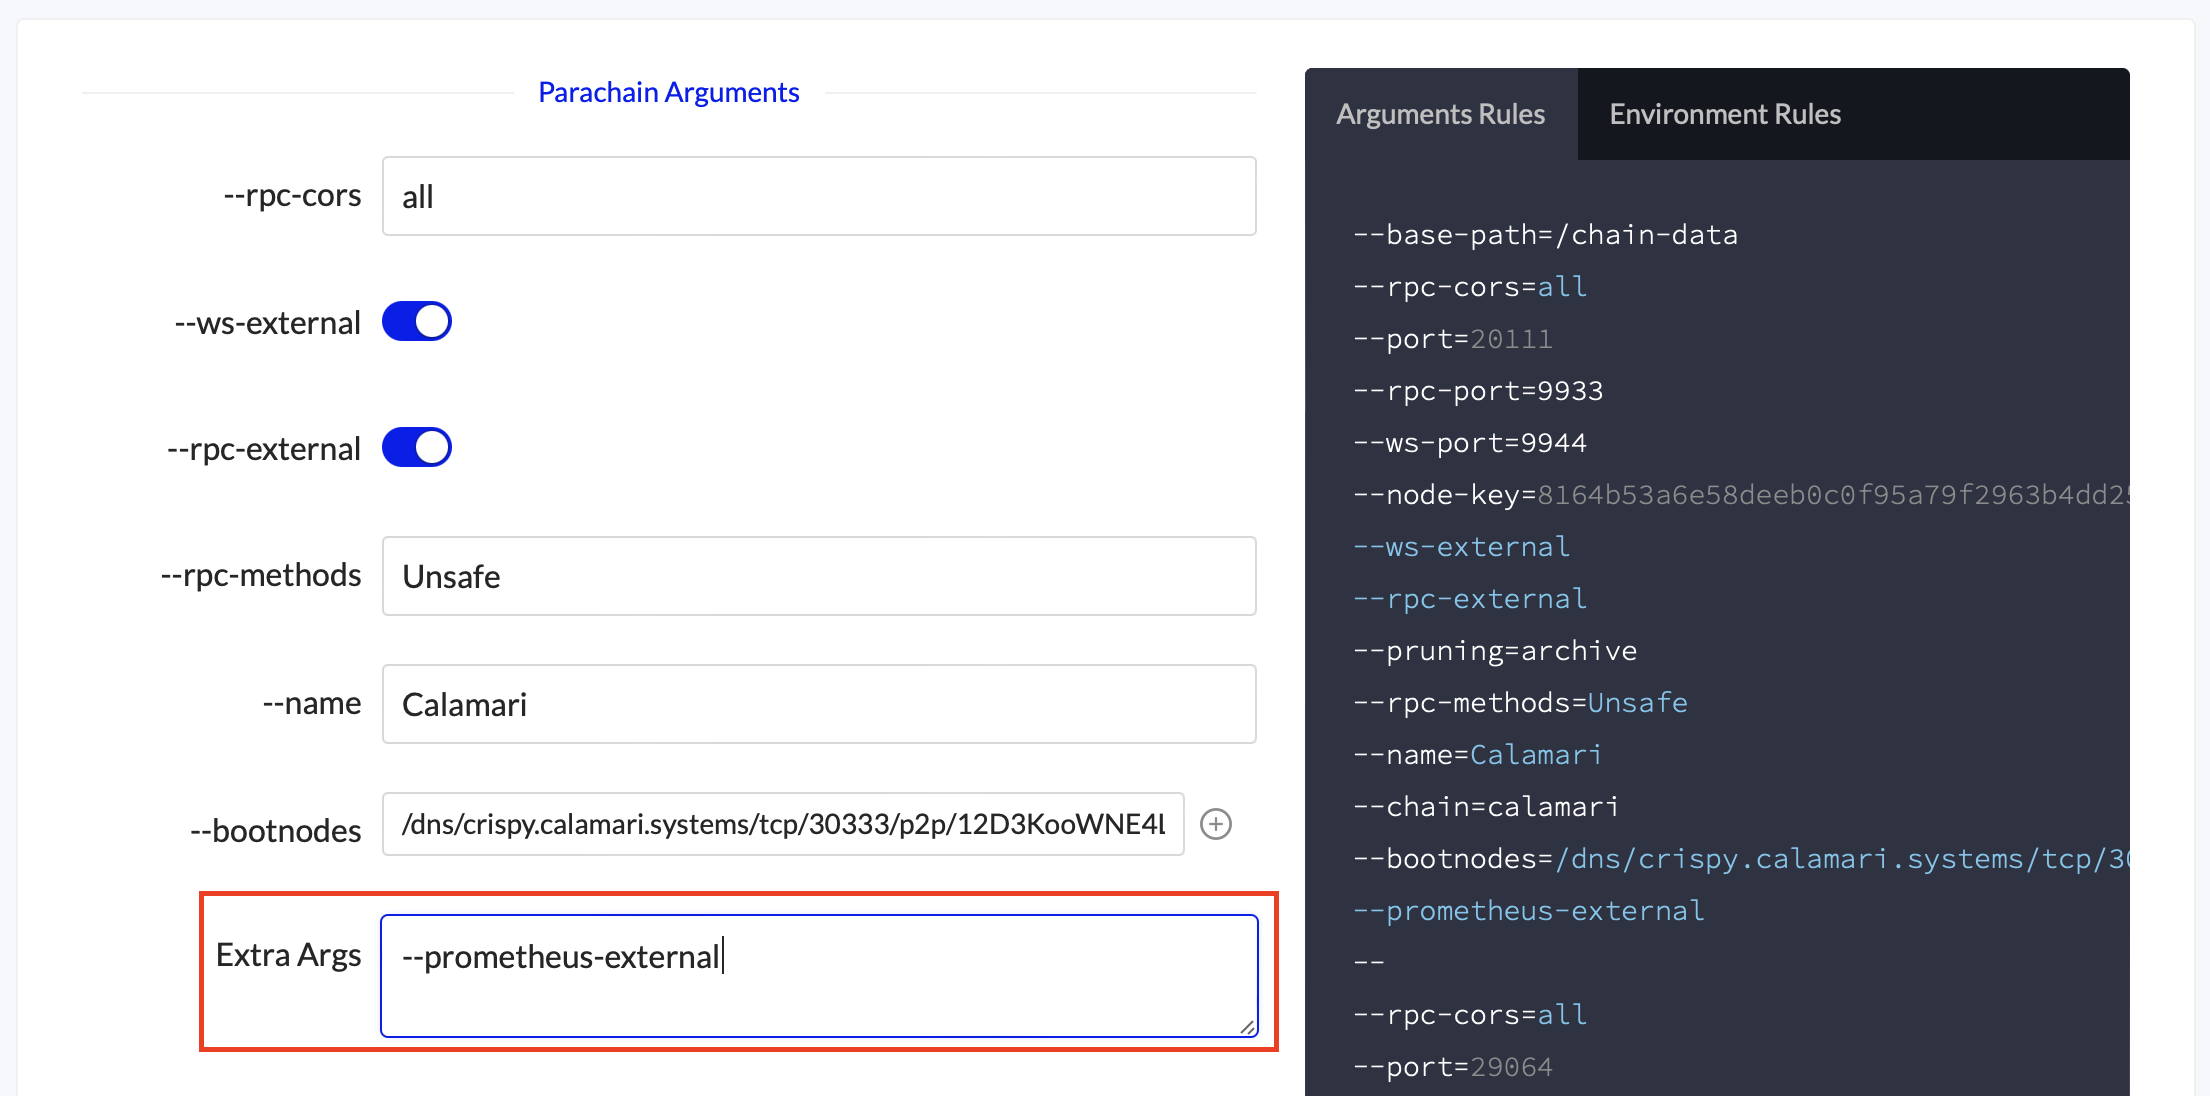
To enable the metrics endpoint, add --prometheus-external to your node’s Launch Arguments
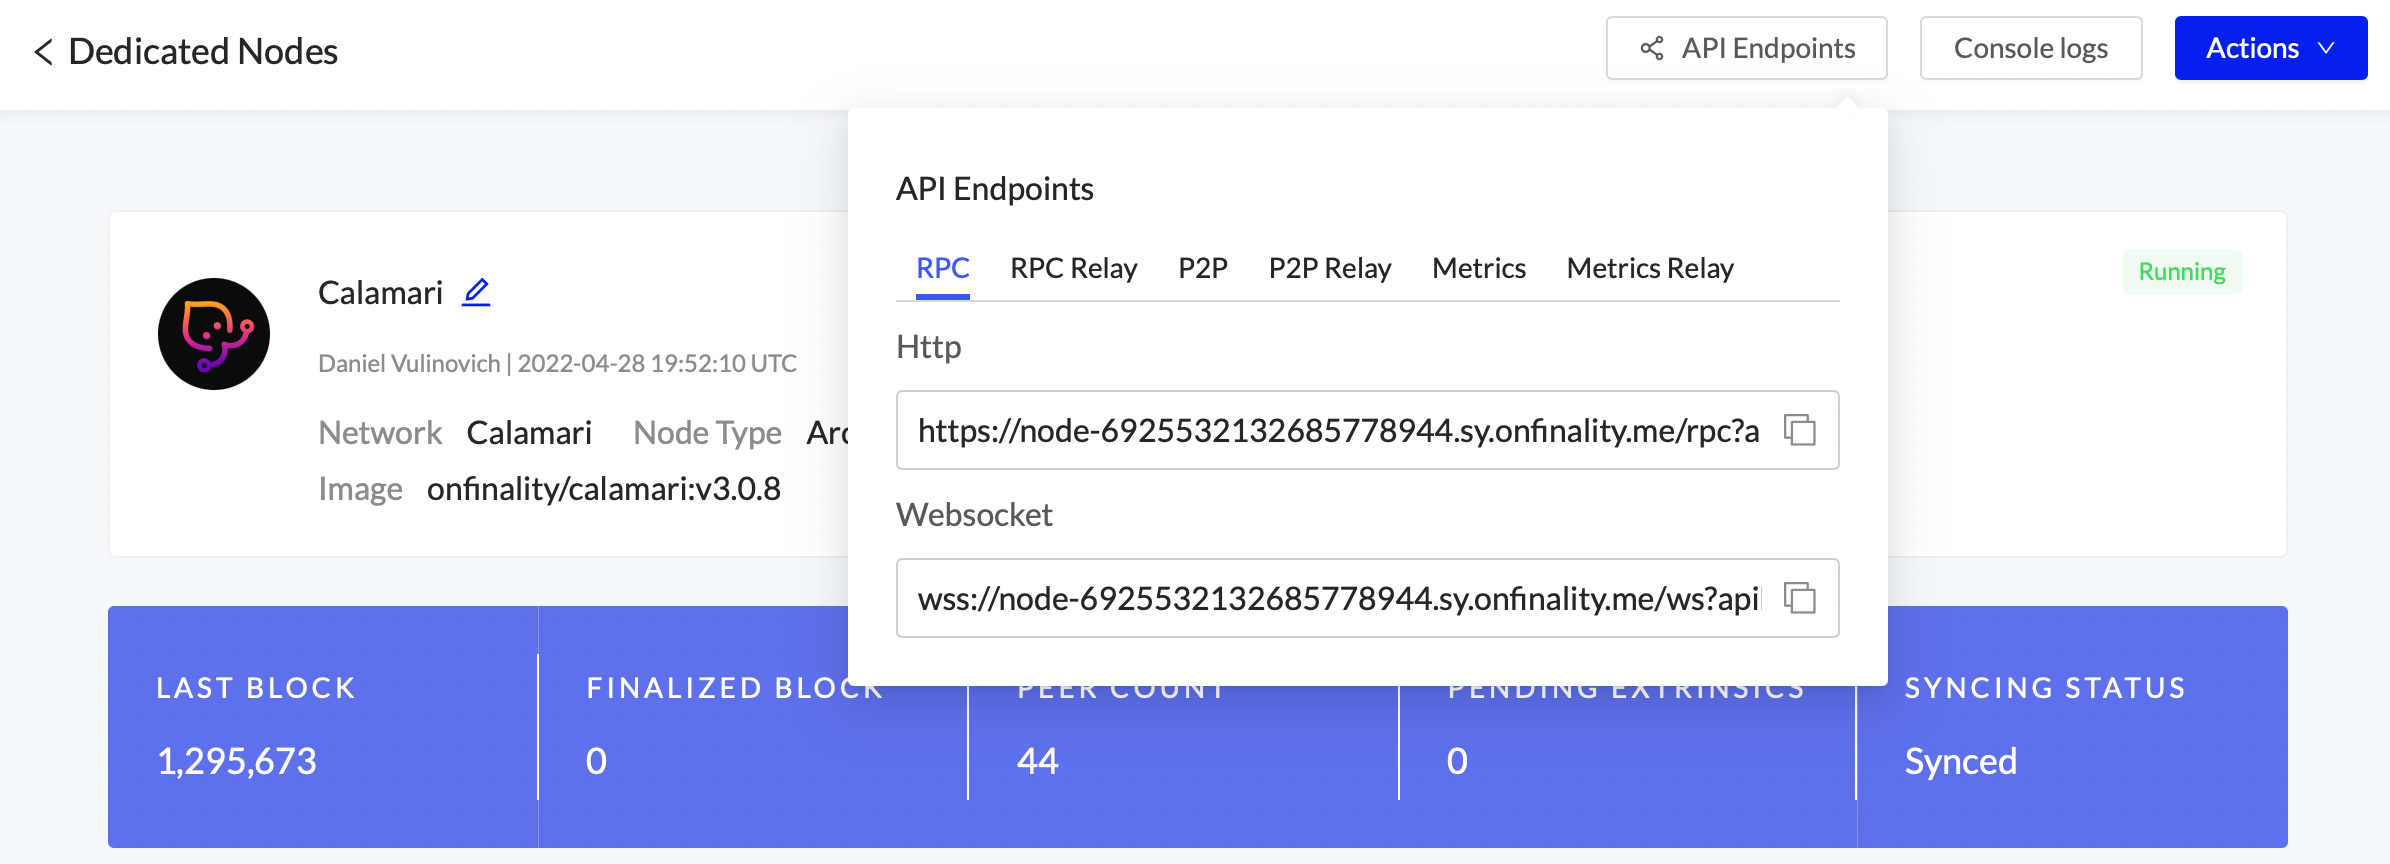
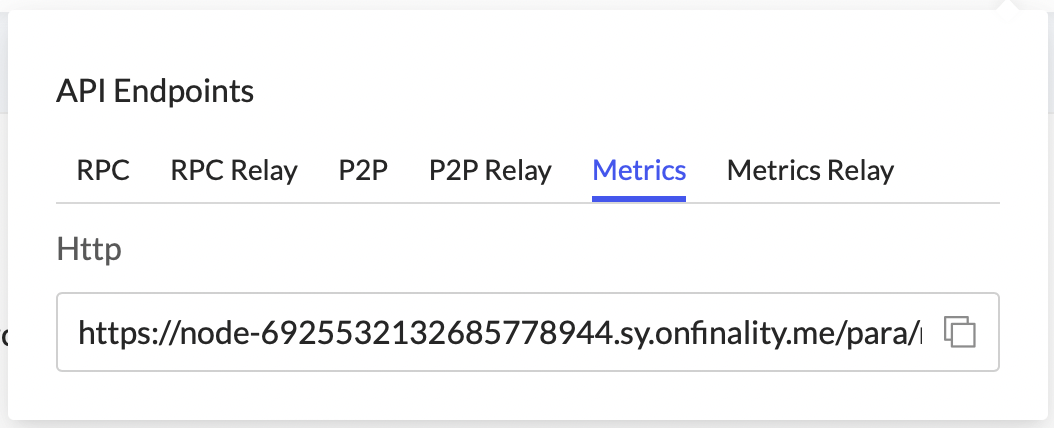
1.1) View your Dedicated Node’s details and click the API Endpoints button
1.2) Select the Metrics tab and copy the argument
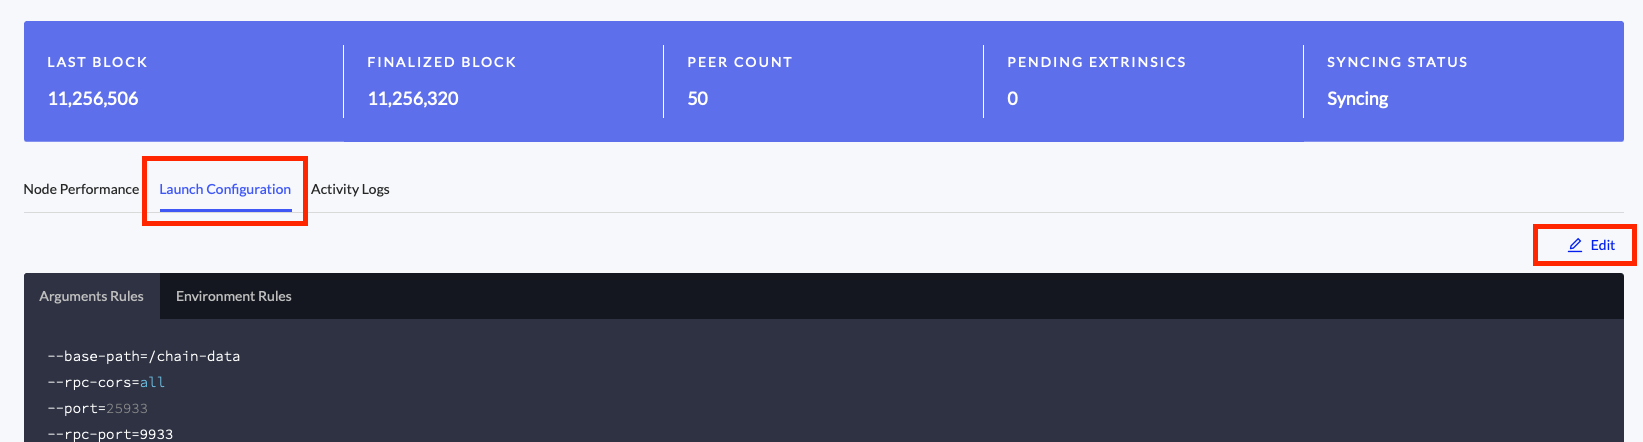
1.3) Edit the node’s Launch Arguments by selecting Launch Configuration and then Edit
Paste the argument from 1.2 into the Extra Args field
After saving the Launch Arguments the metrics endpoint will be available within a few minutes.
If your node is a Parachain there will be separate endpoints available for the Relay Chain, titled Metrics Relay. Follow the steps under the Metrics Relay tab to add the relay chain prometheus argument.
2. Copy the Metrics URLs
Return to the Dedicated Node’s API Endpoints menu and copy the Metrics endpoint.
If your node is a Parachain save the Metrics Relay endpoint too
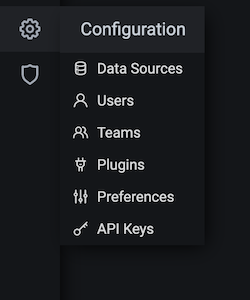
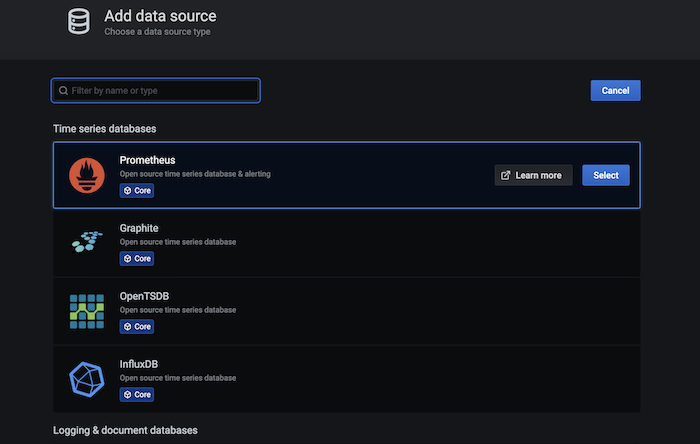
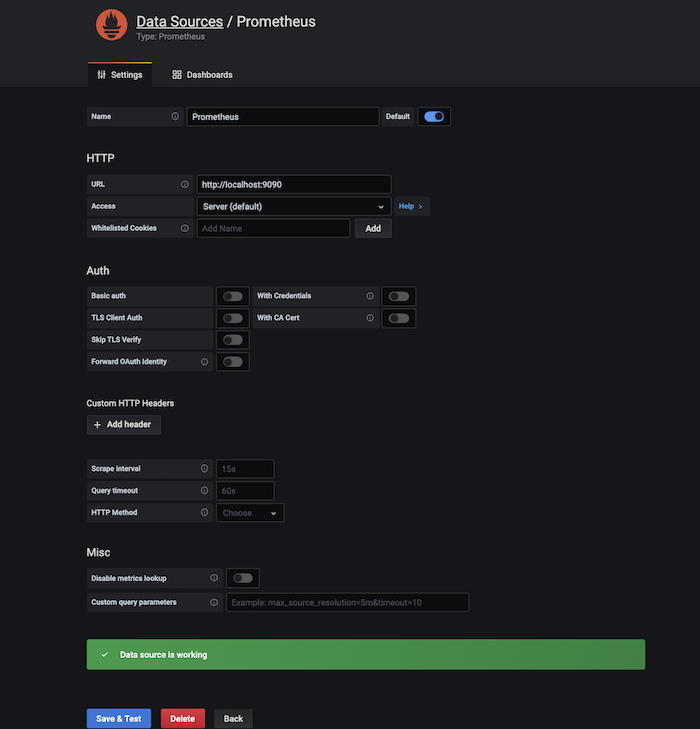
3. Configure Prometheus
Configure Prometheus to scrape from your Dedicated Node’s Metrics endpoint using one of the example configurations below.
Example Prometheus Configurations
Stand Alone (Solo Chain) Node
Connect prometheus to a stand alone (or “solo chain”) Dedicated Node
This example was taken from a node with metrics URL https://node-{{nodeID}}.lh.onfinality.io/node/metrics?apikey={{apiKey}}
Prometheus.yml:
CODE
global:
# scrape_interval: 15s # By default, scrape targets every 15 seconds.
# A scrape configuration containing exactly one endpoint to scrape:
# Here it's Prometheus itself.
scrape_configs:
# The job name is added as a label `job=<job_name>` to any timeseries scraped from this config.
- job_name: 'substrate_node'
# metrics_path defaults to '/metrics'
# scheme defaults to 'http'.
scheme: 'https'
metrics_path: '/node/metrics'
# Override the global default and scrape targets from this job every 5 seconds.
# ** NOTE: you want to have this *LESS THAN* the block time in order to ensure
# ** that you have a data point for every block!
scrape_interval: 5s
params:
apikey: ['{{apiKey}}']
static_configs:
- targets: ['node-{{nodeID}}.lh.onfinality.io']
Parachain
Connect Prometheus to both the Dedicated Node’s Relay Chain and Parachain metrics endpoints.
This example was taken from a node with the following metrics urls
global:
# scrape_interval: 15s # By default, scrape targets every 15 seconds.
# A scrape configuration containing exactly one endpoint to scrape:
# Here it's Prometheus itself.
scrape_configs:
# The job name is added as a label `job=<job_name>` to any timeseries scraped from this config.
- job_name: 'parachain'
# metrics_path defaults to '/metrics'
# scheme defaults to 'http'.
scheme: 'https'
metrics_path: '/para/metrics'
# Override the global default and scrape targets from this job every 5 seconds.
# ** NOTE: you want to have this *LESS THAN* the block time in order to ensure
# ** that you have a data point for every block!
scrape_interval: 5s
params:
apikey: ['{{apiKey}}']
static_configs:
- targets: ['node-{{nodeID}}.lh.onfinality.io']
- job_name: 'relaychain'
# metrics_path defaults to '/metrics'
# scheme defaults to 'http'.
scheme: 'https'
metrics_path: '/relay/metrics'
# Override the global default and scrape targets from this job every 5 seconds.
# ** NOTE: you want to have this *LESS THAN* the block time in order to ensure
# ** that you have a data point for every block!
scrape_interval: 5s
params:
apikey: ['{{apiKey}}']
static_configs:
- targets: ['node-{{nodeID}}.lh.onfinality.io']
Multiple Nodes
Connect Prometheus to multiple nodes simultaneously
This example was taken from 3 nodes with the following URLs