Deploy a Moonbeam Trace Node
Introduction
In this How-To Guide, you will learn how to run your own Dedicated Trace Node for the Moonbeam Network , enabling you to access the non-standard EVM Trace, Debug, or TxPool RPC methods. This guide should be used alongside Moonbeam's official guide which is kept up to date and more detailed.
What is Moonbeam?
Moonbeam is a smart contract platform for building cross-chain connected applications that can access users, assets, and services on any chain. By uniting functionality from Ethereum, Cosmos, Polkadot and more into a single platform, Moonbeam solves today’s fragmented user experience — unlocking true interoperability and paving the way for the next generation of applications.
Why Run A Moonbeam Trace Node on OnFinality
Geth's debug and txpool APIs and OpenEthereum's trace module provide non-standard RPC methods for getting a deeper insight into transaction processing. As part of Moonbeam's goal of providing a seamless Ethereum experience for developers, there is support for some of these non-standard RPC methods.
To use the supported RPC methods, you need to run a tracing node, which is slightly different than running a full node. There is a different Docker image, called purestake/moonbeam-tracing that needs to be used for tracing. Additional flags will also need to be used to tell the node which of the non-standard features to support.
OnFinality’s Trace Dedicated Node takes care of all that for you, and along with our Lightning Restore snapshots, will have you tracing in a few clicks.
Useful Links
https://docs.moonbeam.network/node-operators/networks/tracing-node/
https://docs.moonbeam.network/builders/build/eth-api/debug-trace/
Maintain and Upgrade your Dedicated Node
Dedicated Node Launch Arguments
How to Deploy a Moonbeam Trace Node
1. Log in to OnFinality
Create an account and log in to OnFinality, then add a payment method.
2. Create Dedicated Node
Select the Dedicated Nodes menu and press Deploy New Node
2.1 Select Network
Search for Moonbeam and then click Deploy Node
2.2 Configure Moonbeam Node
Enter an easily identifiable Display Name and select the Trace Node Node Type. Select the latest Image Version.
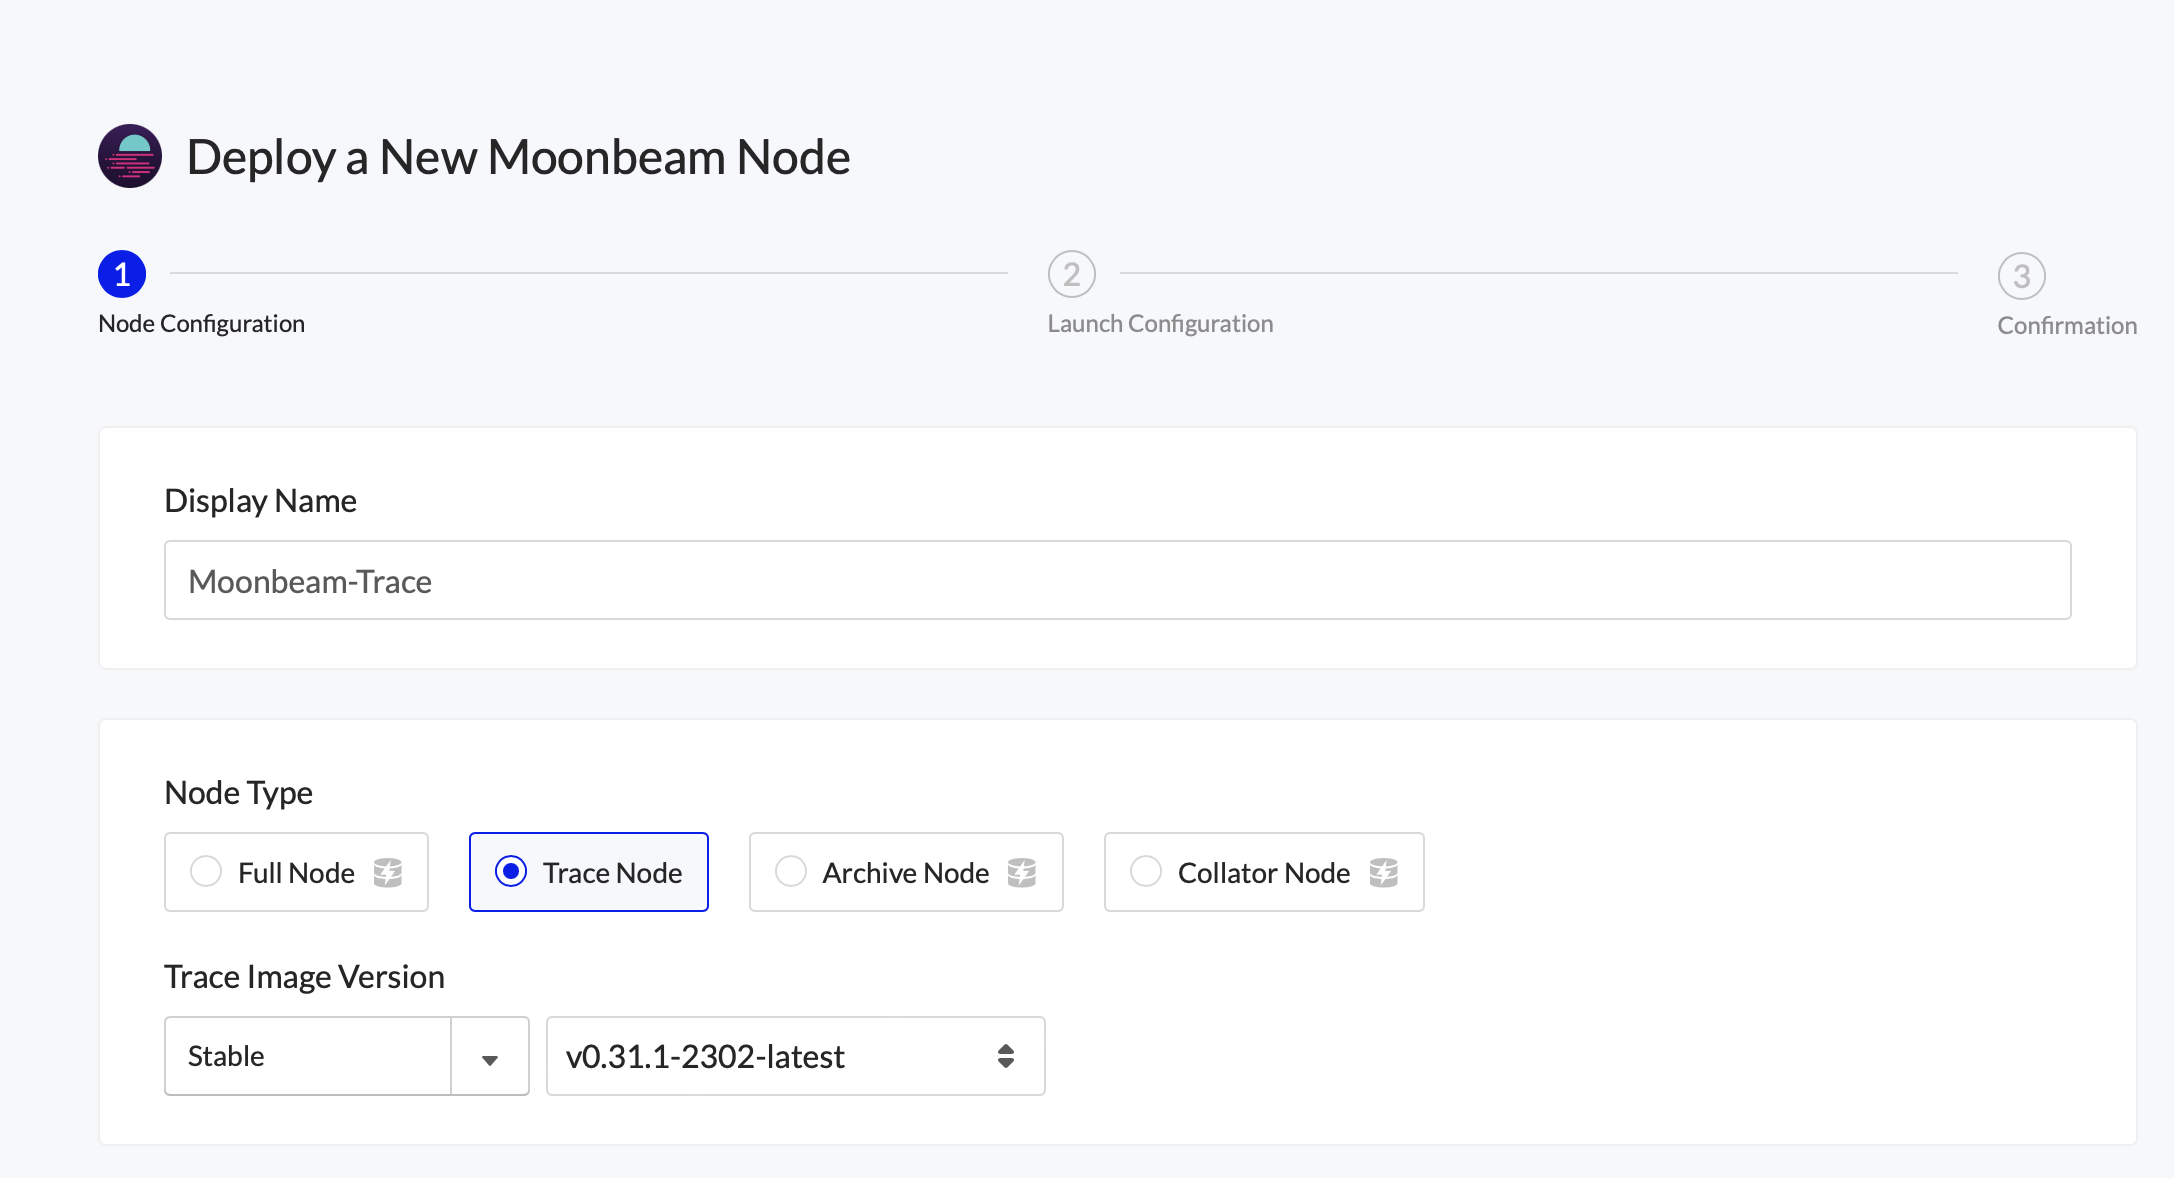
Scroll down to set the Cloud Provider and Region where you will run the node.
Look out for the Lightning Restore indicator to get the node running as fast as possible.
Use at least the recommended configuration suggested by the network, then press “Next”
2.3 Configure Launch Arguments
Next, review the node’s Launch Configuration. The recommended settings are usually sufficient and have all relevant arguments for trace enabled, but we recommend comparing with Moonbeam's official guide to be certain.
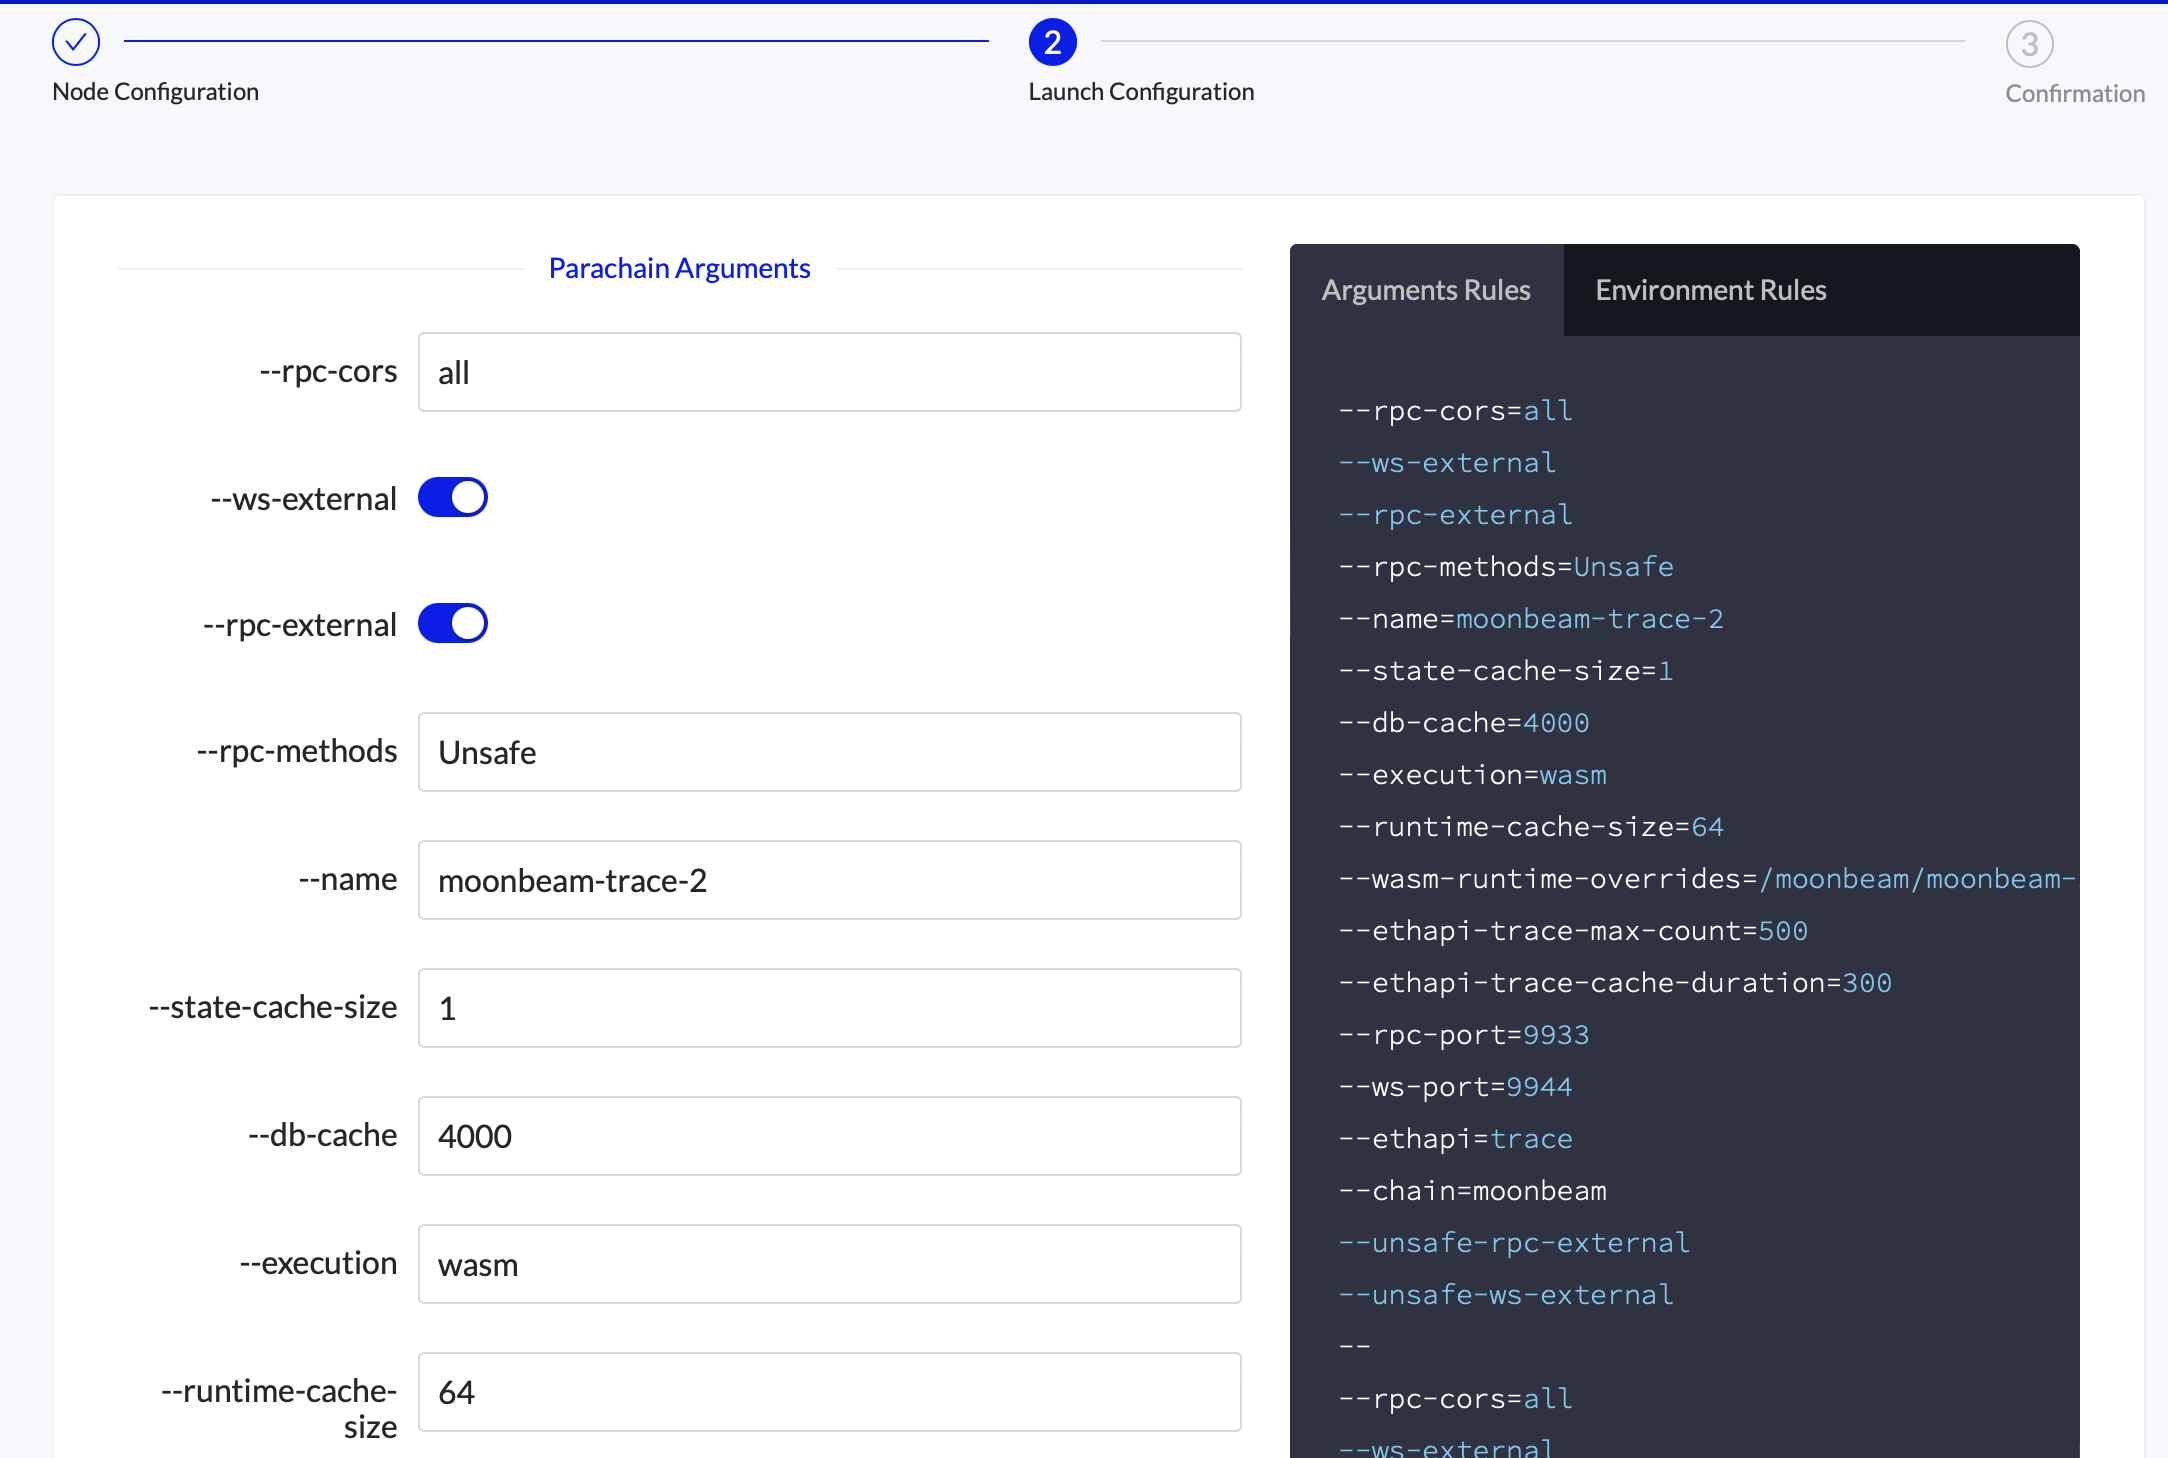
Access the debug or txpool endpoints by updating the --eth-api argument
--ethapi=trace*Default - optional flag that enablestrace_filter--ethapi=debug- optional flag that enablesdebug_traceTransaction,debug_traceBlockByNumber, anddebug_traceBlockByHash--ethapi=txpool- optional flag that enablestxpool_content,txpool_inspect, andtxpool_status
Press “Next” at the bottom of the screen
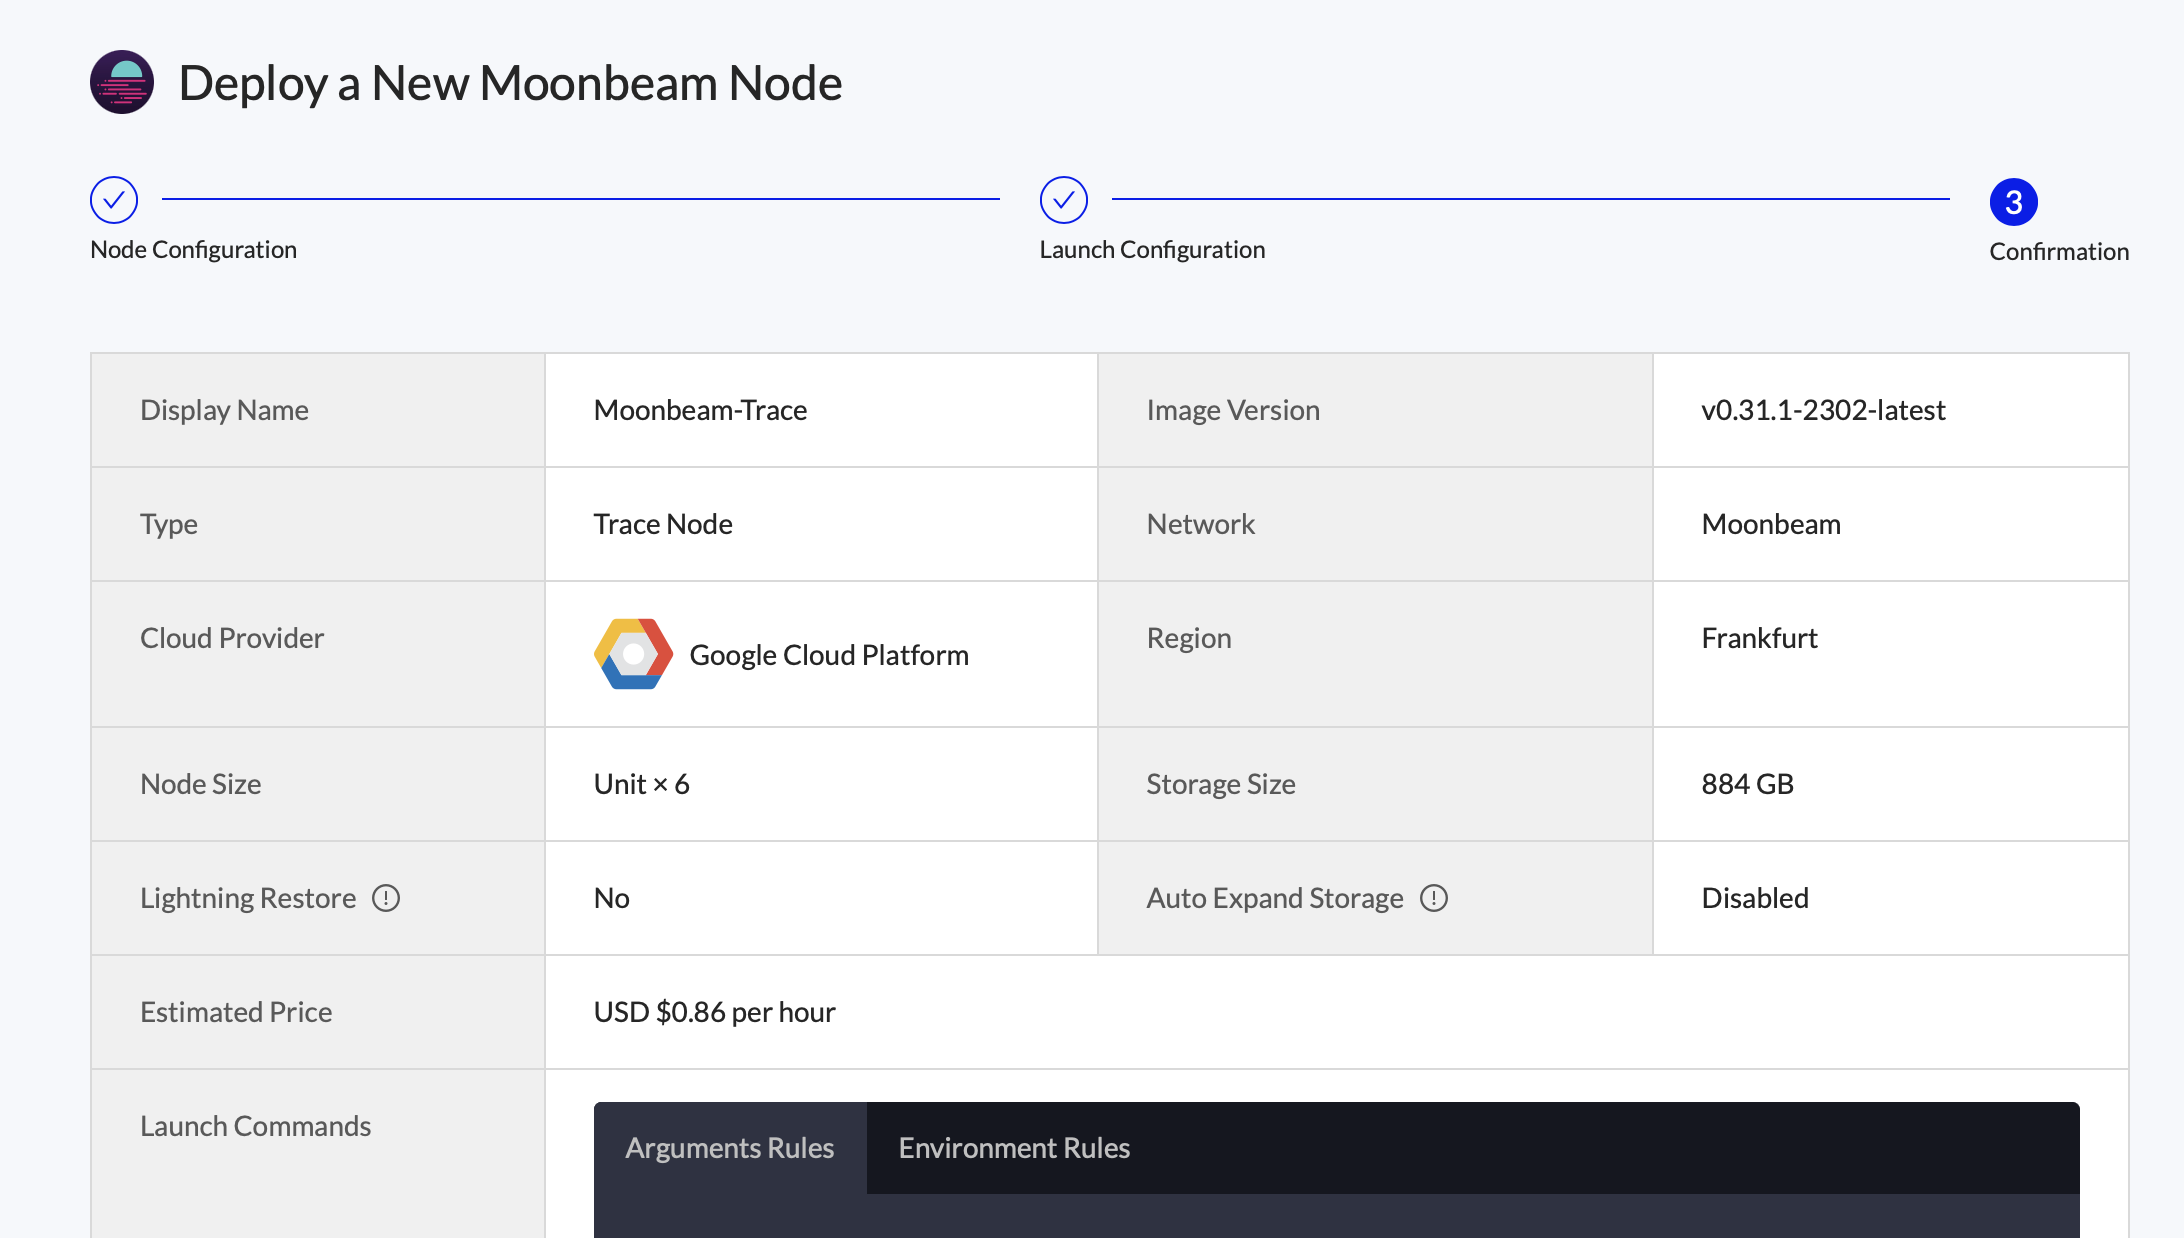
2.4 Review Node
Finally, review the node’s settings and press “Deploy Node”
3. Copy Dedicated Node’s RPC Endpoint
Once your node is successfully deployed, you can find it in the “Dedicated Nodes” section on our portal.
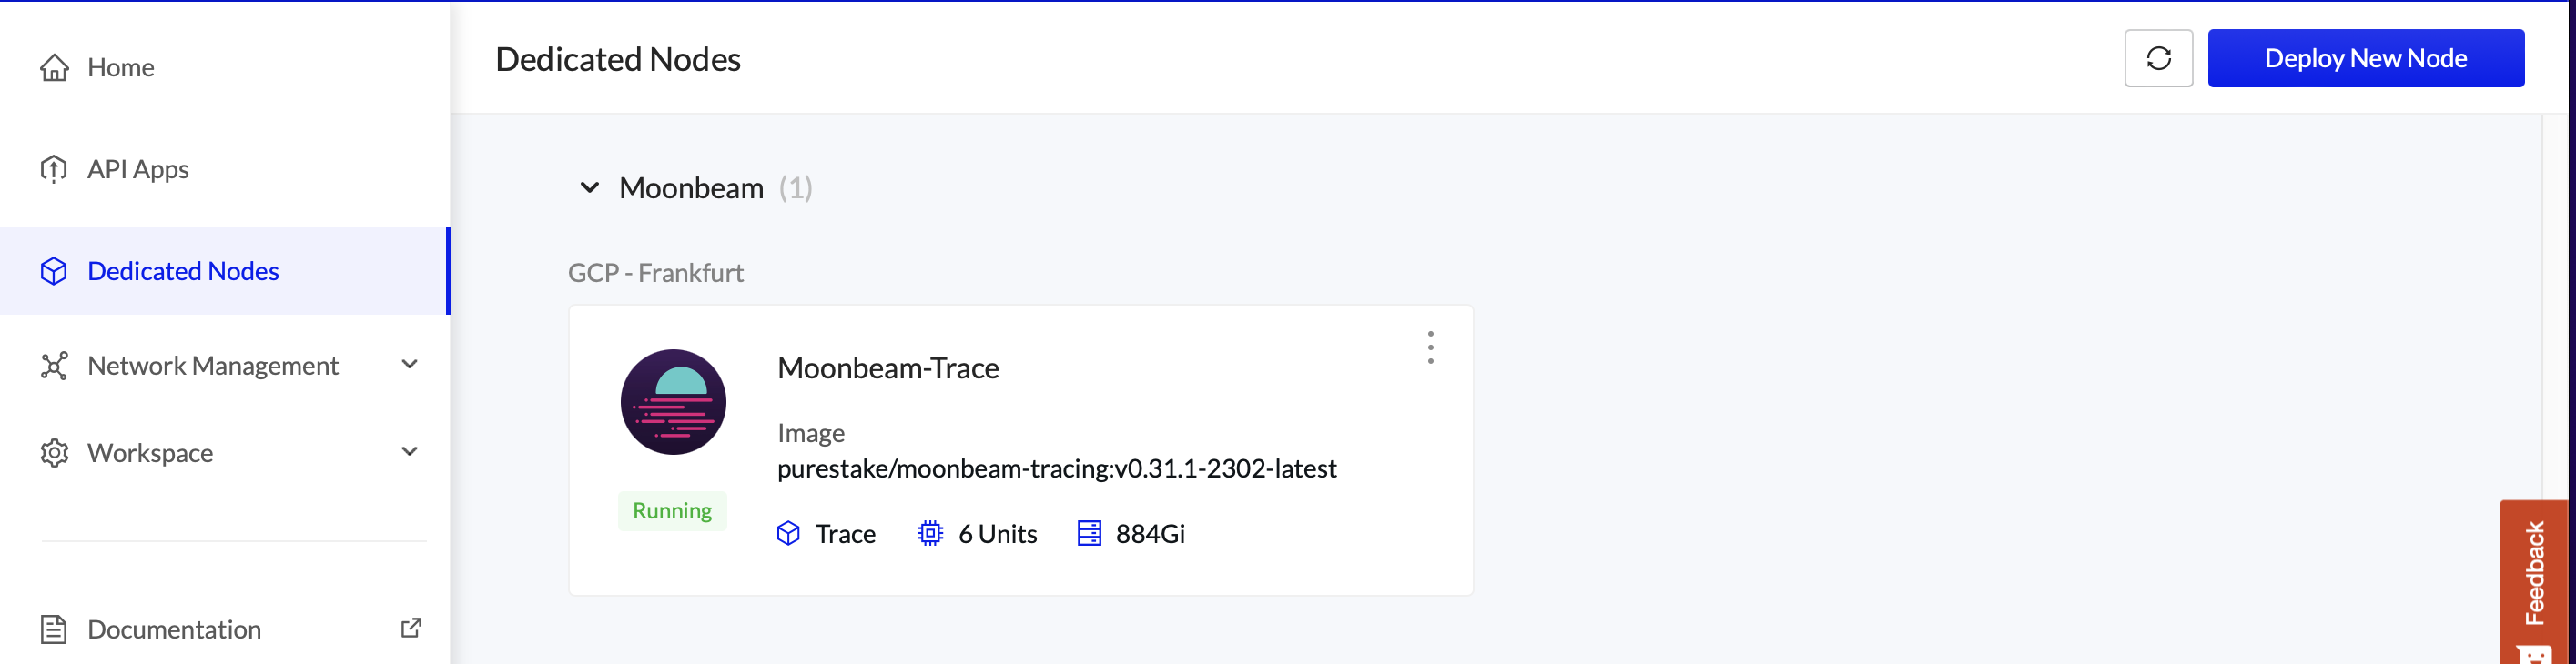
Once the status has changed to Running, you will find the RPC endpoint by clicking on the node and opening the API Endpoints window
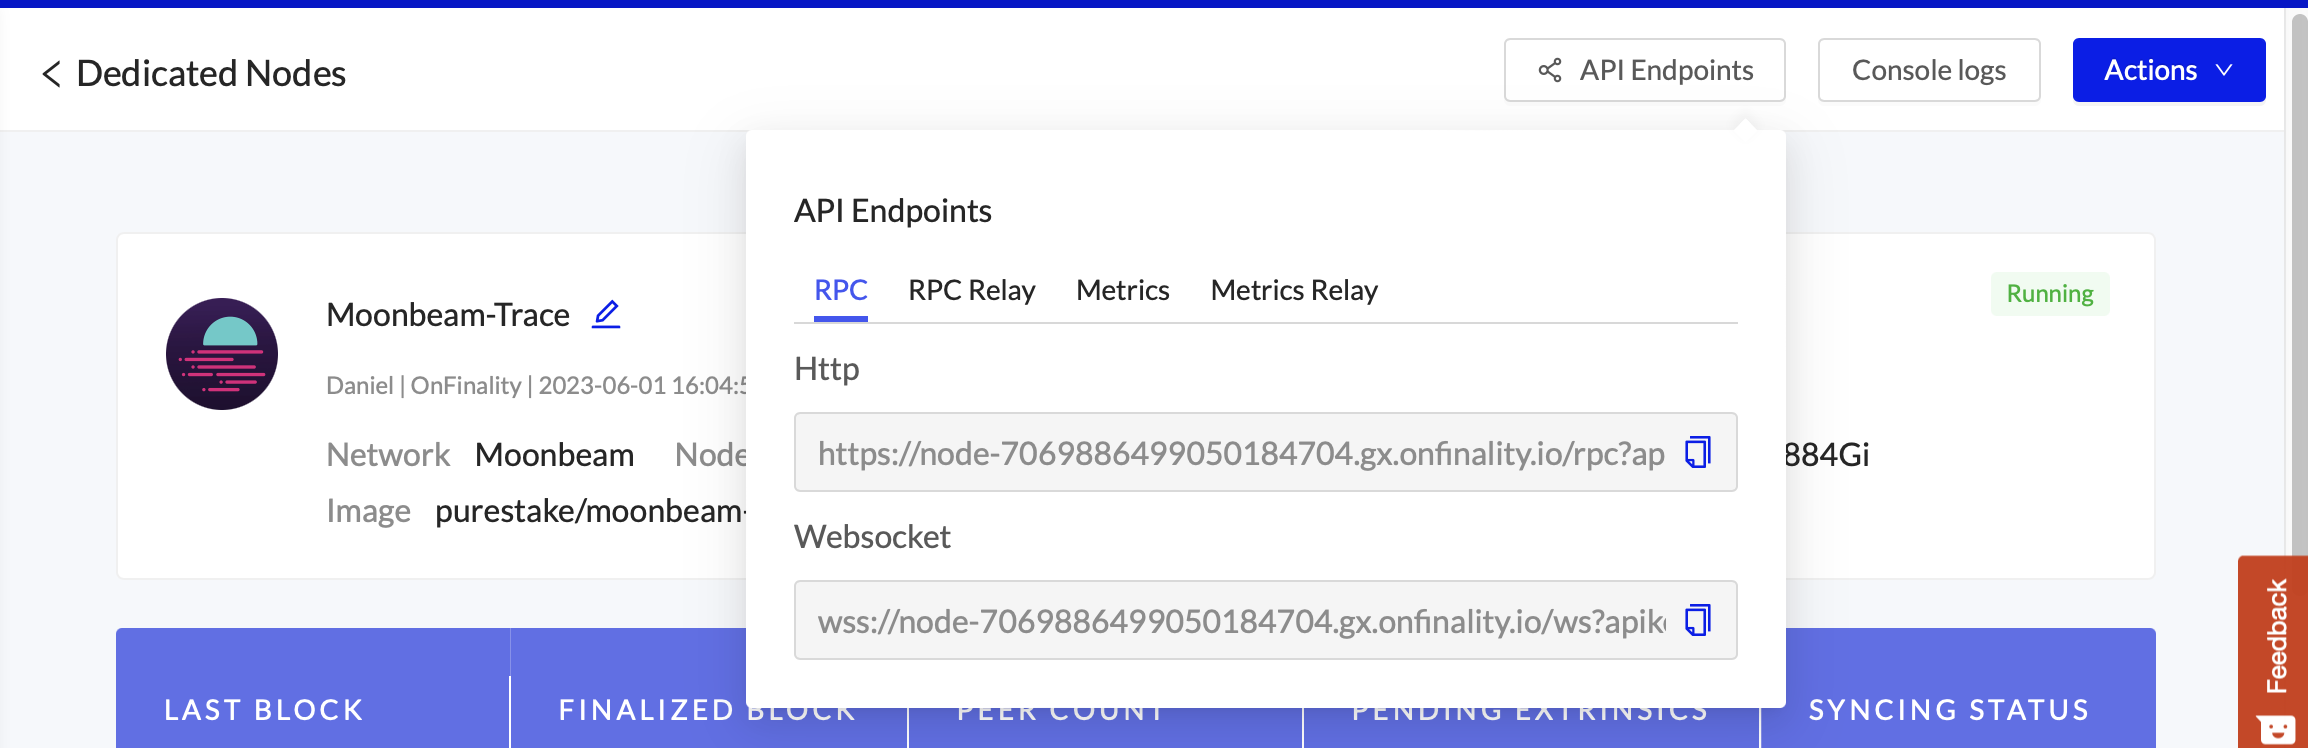
Note: The endpoints are secured by an API Key and should be kept private
Congratulations!
You’re ready to start tracing. For more information on how to use these methods with a tracing node, check Moonbeam’s Debug & Trace guide.